“In every block of marble, I see a statue as plain as though it stood before me, shaped and perfect in attitude and action. I have only to hew away the rough walls that imprison the lovely apparition to reveal it to the other eyes as mine see it.” – Michelangelo di Lodovico Buonarroti Simoni

Not that we’re comparing ourselves to Michelangelo, but we do wholeheartedly embrace his sentiment in the above quote.
As a business leader, you have a ton a questions and know that most of the answers are trapped inside your organization’s data.
We’re right there with you!
As analysts, we’ve always believed that there are valuable stories needing to be heard inside every data set – they often need our expertise to be found and told.
Increasingly, these stories (actionable insights) are the difference between winning and losing, or becoming a great organization as opposed to merely being a pretty good one.
Tom Davenport and Jeanne Harris make this exact assertion in their 2007 book “Competing on Analytics – the New Science of Winning.” And over the past several decades, being able to compete (and compete better) based on analytics has been a top priority for corporate boards and C-Level executives.
This can partially be attributed to popular books showcasing competitive advantages through data and analytics such as “Competing on Analytics,” in addition to “Scoring Points: How Tesco Continues to Win Customer Loyalty” by Clive Humby, Terry Hunt, and Tim Phillips (Kogan Page – 2003), “Moneyball: The Art of Winning an Unfair Game” by Michael Lewis (W.W. Norton – 2004), “Super Crunchers” by Ian Ayer (Penguin Random House – 2007), and “The Analytics Revolution: How to Improve Your Business by Making Analytics Operational in The Big Data Era” by Bill Franks (Wiley – 2014).
However, being analysts, we recognize that these books weren’t written to create demand for analytics and analysts; rather, they were (supplied) in response to broader market forces (demand).
For as long as anyone has tried to gain a competitive advantage in anything, there has been a demand for being able to compete smarter and faster. This isn’t a new thing.
However, what is new-ish today (relative to twenty or thirty years ago) is actually four things:
1) Amount of data being produced and available for analysis
There are literally mountains of data being generated every day throughout the world!
Let’s admit it. We’re all living in a digital age where 4.5 billion internet-enabled people are doing thousands of different things, creating a 3.0 Exabyte (approximately 3 billion Gigabytes) digital wake each and every day.
Just think about all of the data each of us create daily through emails, text messages, phone calls, Zoom meetings, Google search, eCommerce shopping, Facebook, YouTube, Twitter, Instagram, Pinterest, Strava, TikTok, Yelp, etc. And, not to mention the continual digital residue we leave with the GPS transmitters in our smartphones, smartwatches, and cars.
For businesses, aside from all of the data noted above and their normal operating and financial data, the Internet of Things (IoT) has turned their data production volume up to eleven! Sensors have been deployed everywhere and transmitting all sorts of valuable information about how machinery, systems, and people are operating and functioning – 24-7-365.
2) Technological advances in data management and storage
In today’s world, data storage is largely a non-issue for many people and organizations. That’s not to say there aren’t challenges associated with organizing and ensuring data quality. But over the past several decades, incredible advances have been made in the areas of magnetic and solid-state data storage, Database Software (e.g., ORACLE, DB2, Teradata, MS SQL Server, Mongo DB, Hadoop, etc.), Centralized Processing Units (CPUs), and Random Access Memory (RAM).
Discs and drives have much more storage capacity and are far more reliable. Database software has become more efficient. Moore’s Law is alive and well with CPUs continuing to get smaller and faster, and RAM continues to expand and improve, further enabling even faster access to tools and data.
3) Democratization of sophisticated analytical tools
Not too long ago, data and statistical analysis were purely the realms of analysts with specialized and/or advanced degrees in quantitative fields. To do their jobs, analysts needed programming language skills and mastery of mathematical statistics and measurement theory. Analysts HAD to know things like sample theory, matrix convertibility and invertibility, moment generating functions, central limit theorem, and independence from irrelevant alternatives (IIA).
Today, however, there is an abundance of relatively easy-to-use (e.g., drag-and-drop or point-and-click) and inexpensive (or, in the case of Python and R, FREE) software and tools available for data and advanced statistical analysis. In our opinion, this is both a good thing and a bad thing.
On the positive side, it is now “easier” and less expensive to perform all sorts of analytics. And we absolutely believe more people looking at data and thinking about empirical outcomes is a good thing! We’re huge fans of tools like SAS, R, Python, Alteryx, Tableau, EViews, Power BI, etc. They’ve made our jobs MUCH MUCH easier! But, this “democratization of analytics” does come with some downsides.
We’ve all heard the expression “garbage in, garbage out.” And this expression couldn’t be more true than it is right now. Today’s analytical software tools have made it incredibly easy to ingest (import) data for analysis. But just because you can get the data in doesn’t mean that the data are “good.” And by “good,” we mean “clean” and “appropriate” for the types of analysis being conducted. One of our favorite sayings is “a fool with a tool is still a fool, and possibly more dangerous.” Just because someone can perform statistical analysis and generate a fancy output doesn’t mean that it is “good” or should be relied (acted) upon.
4) How affordable it has become to store all of this data – (which is actually the result of demand being met by supply in a highly competitive market structure)
As we noted earlier, most organizations now have a ton of data that needs to be stored. In response to this demand, storage is readily available and relatively inexpensive compared to yesteryear. Not too long ago (mid-90s), a high performance 1 Gigabyte hard drive cost more than $2,500. Today you can store 1 Petabyte (1,000 Terabytes) with AWS for about $22,000 per month and purchase a 1 Terabyte (1,000 Gigabytes) USB flash drive for $700.
What all of this really means is that there is huge (underserved) demand for expert analysts and data scientists who know how to Manage, Analyze, and Synthesize all of these valuable data assets.
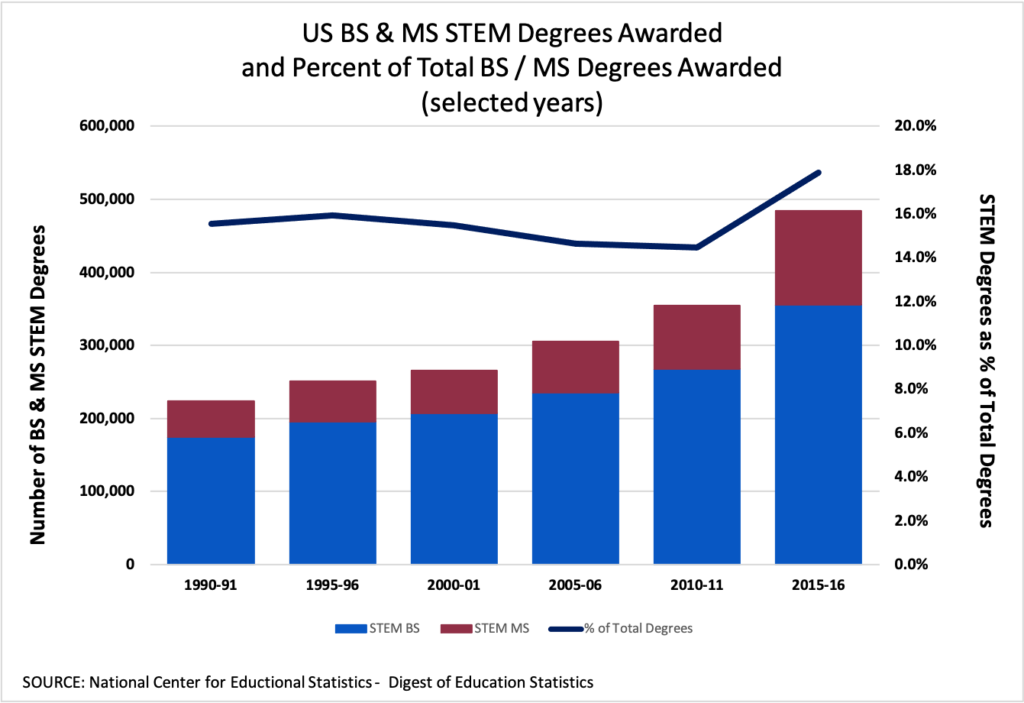
A 2017 IBM Report projected that the number of positions for data and analytics talent in the United States by 2020 would increase by 364,000 openings, to 2,720,000.
According to the most recent data from the National Center for Educational Statistics, there has been a response to the demand for data-savvy / technically capable college graduates in terms of STEM degrees awarded (see graph below). However, it is important to keep in mind that only a small proportion of these individuals earning degrees in STEM fields elect to pursue careers in data analytics or data science.
All of these market forces combined are contributing to a perfect storm in the fields of data management and advanced analytics. There is an insatiable (and growing) appetite for actionable and dependable insights in the face of an insufficient supply of people who can do this work.
We’re here to help!
As our mission states, our goal at Next Level Growth Strategies is to fully utilize our expertise to help brands identify and achieve their Next Level of growth.
As strategic analytics consultants, our commitment is to:
- Help you understand WHAT’s really going on with your business and your customers
- Understand WHY it’s happening
- Identify viable options for HOW to move forward, and
- Work with you to chart a plan for achieving your NEXT LEVEL of profitable growth!
Our areas of specialization:
- Customer (Attitudinal and Behavioral) Segmentation
- Customer Response (Lift) Modeling
- Marketing/Media Mix Modeling & Optimization
- Brand Measurement
- Demand Modeling & Forecasting
- Price Elasticity Modeling & Price Optimization
- Experimental (Test) Design & Measurement
- Retail Real Estate Site Selection & Market Optimization
Our “No-Box” Approach:
We don’t have a Black Box. There is No Box! It’s that simple!
The way we look at it, it’s your business and your data. And the work we produce is for you; it’s yours! All of it!
We don’t really have any trade secrets when it comes to data analytics and statistical modeling. In fact, all of the techniques we utilize are well documented all over the Web and in a ton of academic journals.
Our special sauce is that we are actually business-minded marketers who also have mad analytical skills and a ton of experience across a wide variety of industries!
Our Approach to Helping You:
We begin every analytics engagement the same way. That is getting to know you, your business, and the problem you are trying to solve.
Look, no problem (or business) is the same – although there are often similarities across engagements. But rest assured, we don’t have a one size fits all approach to analytics.
Think of it like this, if you hired a master carpenter to remodel your kitchen and he showed up the first day with only a hammer, you’d fire him.
Over the years, we’ve put A LOT of statistical tools in our toolshed. They all have a purpose. But to be honest, we won’t know which ones are needed until we fully know what needs to get done.
We do, however, start every new engagement the same way:
1) Understand your objective(s) – that is, what are YOU trying to learn, do, or improve? This is about you and your business – not us.
2) Understand the business, your customers, and your competition. Analysis in a vacuum is a really bad idea. Context is critical! Our understanding of the big picture serves as your analytical conscience.
3) Understand the data you’re currently working with – the good, the bad, and the ugly. There’s often a lot of bad and ugly in the beginning, but we’re experts at making that “good” pretty quickly.
At the end of the day, it’s about getting you useful (actionable and reliable) results that can help you drive your business. Our measure of success is whether or not you can consistently make better decisions – faster. We like to call it systematically getting you more at-bats and improving your batting average.
Look, what we do isn’t for everybody, but the results we deliver are.
Every business can benefit from actionable data-driven insights!
Our analysts love doing this stuff. It’s “their thing!” And they’re really good at it!
It just so happens their thing might give you flashbacks to your Business Stats 203 class. We get it…
This type of stuff is pretty cool to us! What can we say…
What’s even cooler to us is when this stuff helps a client move their needle.
To us, Useful is Cool! Results are cooler!
At Next Level Growth Strategies, we live for delivering useful results that help our clients win and achieve their Next Level of profitable growth!
Need analytical help and useful results?
Let’s Chat!
Next Level Analytics